HELP GUIDE
×
Menu
Quick Guides
Key Performance Indicators charts and graphs
 
Key Performance Indicators charts and graphs
1
Statement title
1. Statement title
Customizable schedule title which appears at the top of the schedule and on the Index Page.
2
Optional foreign exchange heading
2. Optional foreign exchange heading
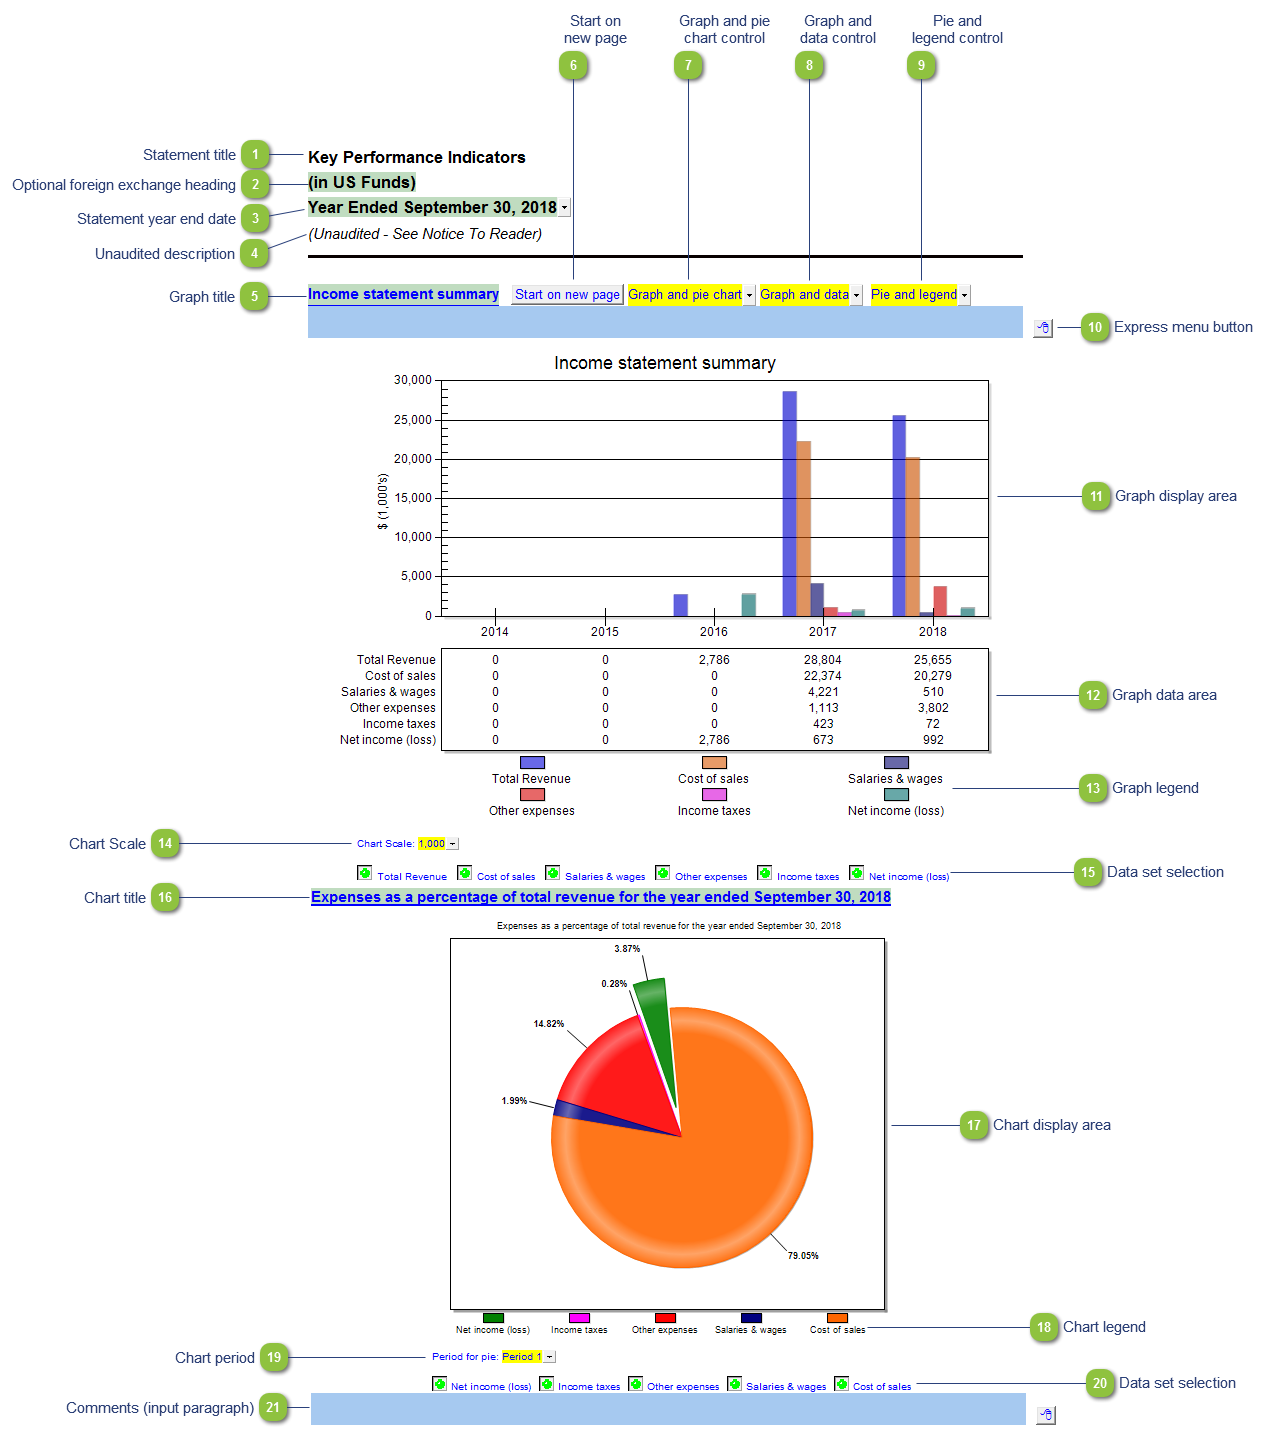
The foreign exchange heading pulls from the selections made in the Columns section of the Home Menu. Double-click on the cell to jump to the Home Menu.
3
Statement year end date
3. Statement year end date
The statement year end date is automatically calculated based on the reporting dates set in the Engagement Properties dialog. Use the popup menu to display an alternative date format.
4
Unaudited description
4. Unaudited description
The newest Review and Compilation standards no longer require '(unaudited)' to show up in the heading. This can be added back in via the Report alert field in the Engagement Report Options
5
Graph title
5. Graph title
Cuztomizable graph title. Double-click to jump to its related calculation or ratio
6
Start on new page
6. Start on new page
Insert a page break to start the graphs/charts on a new page instead of a continuous flow.
7
Graph and pie chart control
7. Graph and pie chart control
Select to display both the graph and chart, or just the graph or just the chart.
8
Graph and data control
8. Graph and data control
Select to display both the graph and data, or just the graph or just the data.
9
Pie and legend control
9. Pie and legend control
Select to display the chart and legend, or just the chart.
10
Express menu button
10. Express menu button
Right-click on the Express menu to insert more linked or manual lines, insert subtotals, sort and delete current lines where the options are available.
11
Graph display area
11. Graph display area
 
Displays the graph for the selected information or ratio.
12
Graph data area
12. Graph data area
 
Displays the data used in the above graph.
13
Graph legend
13. Graph legend
 
The legend for the above graph.
14
Chart Scale
14. Chart Scale
Set the scale for the graph, from 1 - 1,000,000.
15
Data set selection
15. Data set selection
Select which data sets are to be shown on the graph
16
Chart title
16. Chart title
Cuztomizable chart title. Double-click to jump to its related calculation or ratio
17
Chart display area
17. Chart display area
 
Displays the chart for the selected information or ratio.
18
Chart legend
18. Chart legend
 
The legend for the above chart.
19
Chart period
19. Chart period
Set the period for the chart, from Period 1 - 5.
20
Data set selection
20. Data set selection
Select which data sets are to be shown on the chart.
21
Comments (input paragraph)
21. Comments (input paragraph)
You can edit existing input paragraphs or insert more paragraphs using the express menu. Refer to Input Paragraphs for more information on inserting paragraphs.